I'm overdue for a post but am back with the best reason, a new paper is out! And for the first time in a while it is freely available as it is published in the open access journal Palaeontologia Electronica:
Cuff et al., 2017. Reconstruction of the musculoskeletal system in an extinct lion. Palaeontologia Electronica 20.2.23A: 1-25.
As my last paper post was also on
Panthera atrox (
or at least its brain) hopefully everyone already knows what I am talking about. If not,
P. atrox is an extinct lion from North America. The species evolved from a "cave" lion (
P. spalaea) population from Eurasia that crossed the Bering Sea around 340,000 years ago. These lion populations in turn split from the lineage that gives rise to the modern lions about 1.89 million years ago (Barnett et al., 2016).
However, despite this paper being about this cool fossil lion as the specimen of choice, it is more about the methods we are using to help reconstruct extinct animals. When we have only the bones, how do we estimate their masses?
Traditionally we estimate body masses of animals from their bones based on scaling equations (be it lengths, widths, circumferences etc.). Generally, the long/big bones of the limbs are useful as they tend to scale in a predictable manner with increases in body sizes. In mammals, skulls are also pretty good for this too. As such we can estimate masses of similar animals if we know the lengths of these bones. There is also a more modern method for estimating body masses called convex hulling. This method works by wrapping individual bones or regions (where you connect all the edges of each bone so no bone is left uncovered, basically imagine cling film/saran wrap), adding the volumes together and multiplying the volumes by a calculated density. This method has proved to be surprisingly robust, but is sensitive to the density used (much like the bone scaling is sensitive to which bone/metric). Additionally, whilst great for calculating a decent total mass, it will be highly inaccurate if you are trying to get accurate segment masses as it ignores all the soft tissues (e.g. the muscles which are large proportion of the mass of the limbs). So is there a way to estimate those bits more accurately?
So let us get back to our lion. La Brea Tar Pits is the source of "Fluffy" as our lion is affectionately known. Fluffy is the most complete specimen known to date, so we got all of the bones CT scanned. I then segmented the CT scans to have a lot of digital bones. I imported them into Meshmixer (although any software that you can manipulate 3D models would work) and aligned them into a natural pose. However, even the most complete
P. atrox individual was not complete (or at least not completely scanned) and the Fluffy reconstruction was lacking the ribs, tail, hands and feet. These missing bits were replaced with equivalents from Asian lion (
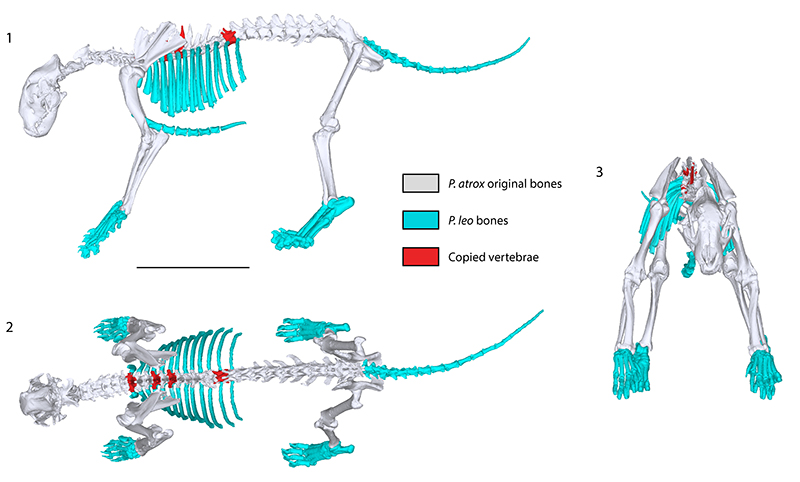
P. leo persica) that I scaled to match the expected size (based on scaling equations of head and femoral length). This gave us a skeleton:
 |
| Fig 2 from Cuff et al., 2017. Skeletal reconstruction showing the original bones from Panthera atrox and those which have been copied from other vertebrae (red), or from P. leo persica (blue). 1, lateral; 2, dorsal; 3, anterior views. Scale bar is 50 cm. |
We had a predicted mass from the bones (195-219kg) and wanted to see what convex hull results would produce:
 |
| Fig 4. from Cuff et al., 2017. Convex hull model from the reconstructed Panthera atrox skeleton shown in Figure 2. 1, left lateral view; 2, dorsal view. Scale bar is 50 cm. |
The volume reconstruction from the convex hull gave mass estimates of 180-219kg satisfyingly close to that predicted from the bones alone, but perhaps not unsurprising as we scaled some important regions from the Asian lion to match the mass generated from the bones (it is a little circular). However, as discussed before you can see how small the limbs look, particularly the upper region compared to what an expected healthy animal would look like.
This is where we did something clever. Previous work we have done on how muscles scale in living cat species (see papers
1 and
2, or
blog) gives us scaling equations for expected lengths and masses. The Asian lion which we borrowed the various missing skeletal elements from again came in useful. The CT scans of that specimen showed the muscles even without special staining so I was able to segment them out individually.
 |
| Fig. 1 from Cuff et al., 2017. CT scan slice showing an approximately mediolateral view (i.e., longitudinal section) of an Asian lion’s forelimb. 1, Dark grey is adipose and connective tissues, lighter grey is muscles, white is bone. Bottom right corner white is a density calibration phantom (1.69 g cm-3; “cortical bone”). 2, Segmentation of the lion forelimb with select muscles highlighted. Abbreviations: FCU - flexor carpi ulnaris; DDF - deep digital flexors; ECR - m. extensor carpi radialis; Pro Quad - m. pronator quadratus; Abd1 - m. abductor digiti I. | |
|
I then scaled them to the predicted mass of
P. atrox (we were working with 207kg as an average from the bone measures):
Mass P. atrox = Mass P. leo x length scale factor x width scale factor 2
Not all of the muscles could be isolated from the CT scans (particularly the vertebral ones) and neither could most of the tendons of the hands and feet, in both cases due to a lack of contrast on the CT scans. The tendons were reconstructed by creating a tube of material off of the muscle and extending it to the insertion point whilst maintaining the volume to match the predicted mass as best as possible. The result:
 |
| Fig. 3 from Cuff et al., 2017. Muscled reconstruction of Panthera atrox showing the major muscle groups in lateral view. Abbreviations: FCU - m. flexor carpi ulnaris; ECU - m. extensor carpi ulnaris; ECR - m. extensor carpi radialis; EDL - m. extensor digitorum longus. Scale bar is 50 cm. |
If you overlay the muscled reconstruction on the convex hull you can see the differences, with muscles visible wherever they extend beyond the convex hull:
 |
| Fig. 5a from Cuff et al., 2017. Reconstructed muscles overlaid on the convex hull of just the bones. Any muscles that are visible extend beyond the range of the convex hull, thereby demonstrating the underestimation of size by convex hulls based solely on bone |
These massive differences between the segmental masses are not a huge deal for overall mass calculations as the densities of the hulls have correction factors built in, but if we wanted to do more complex modelling this matters a lot (e.g. musculoskeletal modelling). Thus we needed to see if we could create an accurate segmental mass calculation.
We compared the mass estimates for models of the bones, muscles and bones, and convex hulls over the bones, and convex hulls over the muscles on an Asian lion to see which produced the most realistic results. (Un?)surprsingly, convex hull muscle models produce results that are really close to those for the actual lion data (whether that is segmental masses, moments of inertia and segmental centres of mass (See tables 4-6 in the paper)). This gave us confidence in the results for the P. atrox reconstruction and segmental masses which we will be using (hopefully) one day for some musculoskeletal models. The overall body centre of mass doesn't move much, but this is likely due to the fact that the body hull grossly overestimates actual mass as it does not deal with air spaces or soft tissues.
 |
| Fig. 5b from Cuff et al., 2017. Reconstructions showing the posteroventral movement of the centre of mass (COM) between the bone convex hull and the muscled convex hull models of Panthera atrox. Scale bar is 50 cm. |
|
It's a cool method that works, and the results can be achieved using only freely available software (although in our paper we used a licensed segmentation software). It does have the important caveat that the muscle scaling is easily doable as the species in question falls within the phylogenetic bracket of those we have worked on. For species that fall outside of that range (e.g. Smilodon, the other large La Brea felid, which is far more distantly related) this scaling pattern is likely to be more uncertain, although a similar method would probably still produce reasonable results.


No comments:
Post a Comment